Work · Analysis · 03
U.S. Flight Delay Analysis
2.91 million flights, and the discovery that most delay-reduction programmes attack the wrong cause.
- Type
- Analysis
- When
- Predictive analytics · BTS 2019–2023
- Role
- Sole analyst. Data preparation, causal breakdown, modelling, evaluation.
- Scale
- 2.91 million flights · BTS, 2019–2023
In plain language
Almost every airline runs a programme to reduce delays, and most of them aim at weather and crew operations. Across 2.91 million US flights, the largest single cause is neither: 41.1% of all delay minutes come from the aircraft itself arriving late from its previous leg. That is not really a cause. It is yesterday's delay showing up again, propagating along the aircraft's route because the schedule has no slack in it. The finding needed no model at all.
The question
What actually causes flight delay at scale, and can departure risk be predicted from the schedule alone, before the aircraft has moved?
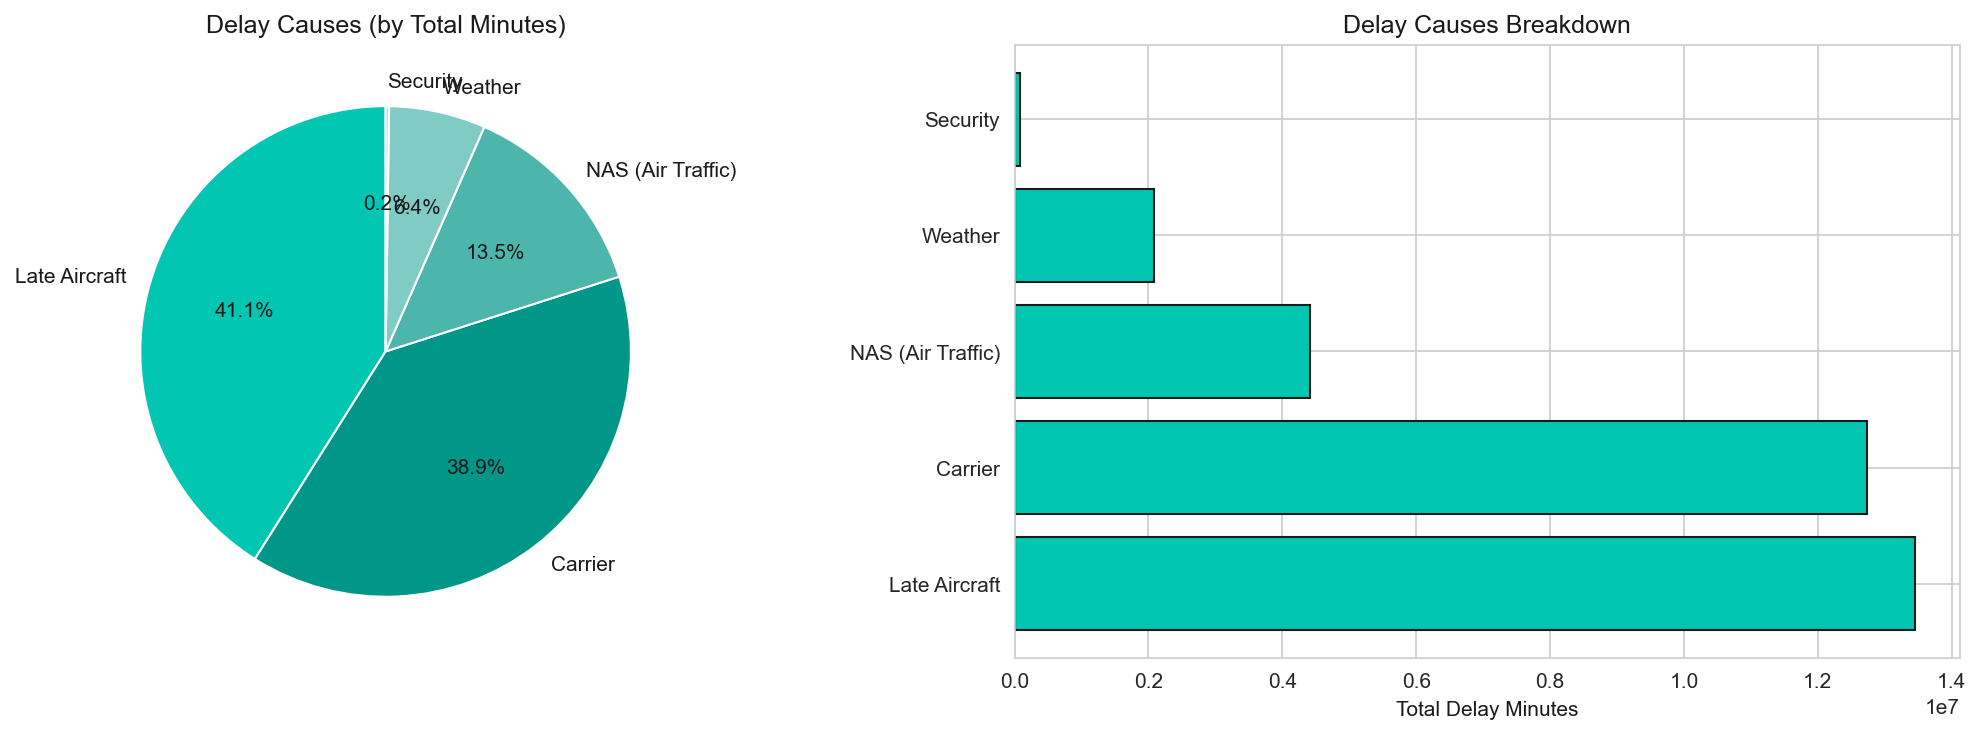
Every airline has a delay-reduction programme. Most of them target weather and carrier operations. The data says that is the wrong target.
The headline
Late aircraft alone accounts for 41.1% of all delay minutes, more than weather, NAS, carrier and security combined.
A late aircraft is not a cause. It is yesterday’s delay, arriving again. The delay propagates through the day along the aircraft’s rotation, which means the single largest driver of delay is the schedule’s own lack of slack.
Prediction from schedule alone
Logistic regression and a decision tree, trained only on data available before the flight departs: carrier, route, scheduled time, day of week, month. No weather, no live feed.
Accuracy lands at 59.2%. That is not a product. But it is meaningfully better than the 17.5% base rate would suggest for identifying structural risk, and it does it without a real-time pipeline.
What I took away
The most useful finding was the simplest, and it needed no model at all: you do not need real-time prediction to identify structural delay risk. You need to look at which rotations have no recovery time. The 41.1% number reframes the whole problem, and it came from a groupby.
How it is put together
Left to right, the path a request or a record takes through the system.
01
Source
- US BTS on-time records
- 2019–2023
- 2.91M flights
02
Prepare
- pandas
- Delay-cause attribution
- 15-minute delay threshold
03
Attribute
- Late aircraft
- Weather
- NAS
- Carrier
- Security
The finding lives here, not in the model.
04
Predict
- Logistic regression
- Decision tree
- Carrier, route, time, day, month
Schedule-only features, deliberately.
What happens, step by step
In plain language, in the order it happens.
Take five years of on-time records
2.91 million US flights from the Bureau of Transportation Statistics, 2019 through 2023.
Attribute the delay minutes
Split total delay by reported cause. Late aircraft alone accounts for 41.1%, more than weather, NAS, carrier and security combined.
Recognise that late aircraft is not a cause
It is the previous delay, arriving again. Delay propagates through the day along the aircraft's rotation, which means the single largest driver is the schedule's own lack of recovery time.
Predict from schedule alone
Logistic regression and a decision tree trained only on what is known before departure: carrier, route, scheduled time, day of week, month. No weather feed, no live data.
Report the ceiling honestly
59.2% accuracy against a 17.5% base rate. That is not a product. It is useful for identifying structural risk without a real-time pipeline, and saying so is more valuable than dressing it up.
Decisions, and what they cost
Every choice worth recording has a road not taken. Both are here.
Schedule-only features
instead ofAdding weather and live feeds
A model that needs real-time weather needs a real-time pipeline to run at all. Constraining to what is known at scheduling time answers a question an airline can act on months ahead, and it makes the accuracy number honest about what it cost.
Report the 41.1% attribution as the headline
instead ofLeading with the model
The most useful finding was the simplest and it came from a groupby. Leading with a 59.2% classifier would have buried the result that actually reframes the problem.
Two simple models
instead ofGradient boosting or a neural net
The interesting question was how much signal exists in the schedule, not how much a stronger learner can squeeze out. Interpretable models answer that question directly; a black box would have answered a different one.
What came out of it
- Late aircraft accounts for 41.1% of all delay minutes, more than weather, NAS, carrier and security combined.
- 17.5% of flights are delayed 15 minutes or more across the five-year window.
- Schedule-only prediction reaches 59.2% accuracy, well short of a product, but enough to flag structural risk with no live pipeline.
- The actionable conclusion needs no model: look at which rotations have no recovery time.
Still open
- Aircraft tail-number rotations would let propagation be traced directly rather than inferred from the cause attribution.
- The 2019–2023 window spans the pandemic, which distorts volume and schedule behaviour in ways this analysis does not control for.
Built with
- Python
- pandas
- scikit-learn
- Logistic regression
- Decision tree