Work · Analysis · 04
Quantifying Data Quality
A four-dimension scoring framework, validated on 9,357 records, and the dimension everyone forgets.
- Type
- Analysis
- When
- FOM M.Sc. group project · 2026
- Role
- FOM M.Sc. group project · framework design, scoring implementation, validation.
- Scale
- 9,357 records · hourly readings with real sensor drift
In plain language
Is this dataset good enough to use? People ask that constantly and answer it by feel. This is an attempt to answer it with a number instead: four dimensions, each scored from 0 to 1, combined into one index. Tested on a real sensor dataset it scores 0.840 overall and looks healthy, except for one dimension: timeliness, at 0.626. Timeliness is also the dimension most frameworks quietly drop, and dropping it here would have reported 0.911 and told everyone that everything was fine.
The question
Can data quality be scored in a way that is comparable across datasets without averaging away the one dimension that fails?
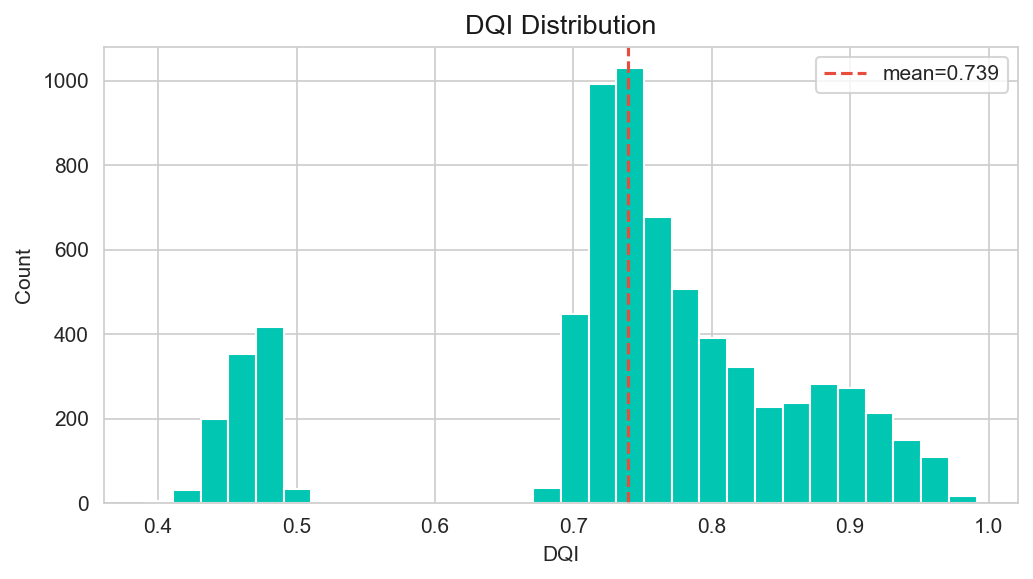
“Is this dataset good enough?” is asked constantly and answered by feel. This is an attempt to answer it with a number.
The framework
Four dimensions, each scored 0–1, combined into a single composite Data Quality Index:
- Completeness: how much is missing, weighted by whether it matters
- Consistency: internal contradictions and constraint violations
- Accuracy: agreement with reference values where they exist
- Timeliness: staleness relative to the decision the data supports
Validated against the UCI Air Quality dataset: 9,357 records, hourly readings, real sensor drift.
The result
Composite DQI of 0.840. Completeness 0.930, Consistency 0.978, Accuracy 0.824, all comfortably passing.
Timeliness scores 0.626, and it is the only failing dimension.
Why that is the interesting part
Timeliness is the dimension that gets dropped. It is harder to measure than the others, it needs a decision context to be meaningful at all, and a dataset can look immaculate on the other three while being too old to use. A composite score that omits it reports 0.911 and tells you everything is fine.
What I took away
A single composite number is convenient and slightly dishonest. The framework’s real value is that it forces the failing dimension into view instead of averaging it away, so the reporting keeps the components visible alongside the composite, always.
How it is put together
Left to right, the path a request or a record takes through the system.
01
Input
- UCI Air Quality dataset
- 9,357 records
- Hourly, real sensor drift
02
Score per dimension
- Completeness: 0.930
- Consistency: 0.978
- Accuracy: 0.824
- Timeliness: 0.626
Each 0–1, each independently defensible.
03
Combine
- Composite DQI: 0.840
- Components retained, not discarded
04
Report
- Composite alongside components
- Failing dimension surfaced, never averaged away
The failing dimension has to stay in view.
What happens, step by step
In plain language, in the order it happens.
Define four dimensions
Completeness: how much is missing, weighted by whether it matters. Consistency: internal contradictions and constraint violations. Accuracy: agreement with reference values where they exist. Timeliness: staleness relative to the decision the data supports.
Score each independently
Each dimension is computed on its own 0–1 scale so it can be defended without reference to the others.
Validate on real data
The UCI Air Quality dataset: 9,357 hourly records with genuine sensor drift, rather than synthetic data where the answer is known in advance.
Combine into a composite
A single Data Quality Index of 0.840, the number a stakeholder actually asks for.
Refuse to hide the failure
Timeliness scores 0.626 and is the only failing dimension. Reporting the composite alone, or omitting timeliness as most frameworks do, gives 0.911 and tells you everything is fine.
Decisions, and what they cost
Every choice worth recording has a road not taken. Both are here.
Keep timeliness in the framework
instead ofThe usual three dimensions
Timeliness is the dimension that gets dropped: it is harder to measure, and it needs a decision context to mean anything at all. But a dataset can look immaculate on the other three while being far too old to use, and that is precisely the failure a quality score is supposed to catch.
Always report components with the composite
instead ofThe single headline index
A composite is an average, and an average hides its worst member. The framework's real value is that it forces the failing dimension into view rather than smoothing it out.
Validate against a real sensor dataset
instead ofSynthetic data with injected faults
Injected faults are the faults you thought of. Real sensor drift produces degradation patterns nobody designs for, which is the only useful test of whether a scoring rule holds up.
What came out of it
- Composite DQI of 0.840 across 9,357 validated records.
- Timeliness at 0.626 is the sole failing dimension, and the one most frameworks omit.
- Omitting timeliness reports 0.911, which is the concrete demonstration of why the framework keeps it.
Still open
- Timeliness needs a decision context to score at all, so the number is not portable between use cases without restating that context.
- Dimension weighting in the composite is currently equal, which is a defensible default rather than a justified choice.
Built with
- Python
- pandas
- Statistical testing
- scikit-learn