Work · Analysis · 05
Does Environmental Performance Drive Economic Growth?
OLS across 38 OECD countries, and an honest null result.
- Type
- Analysis
- When
- 2010–2020 · World Bank Sovereign ESG
- Role
- Sole analyst. Hypothesis design, modelling, testing, and the decision to publish a null.
- Scale
- 38 countries · 11 years · World Bank Sovereign ESG
In plain language
This one asks whether countries that pollute less or use more renewable energy grow their economies faster. Across 38 OECD countries over eleven years, the answer is that this design cannot tell. The model explains essentially none of the variation in growth. It is on the site because a portfolio containing only confirmed hypotheses is a portfolio that has quietly deleted its failures, and because knowing that a plausible relationship does not show up at this level of aggregation is itself worth reporting.
The question
Do CO2 emissions per capita and renewable energy share predict GDP growth across OECD economies?
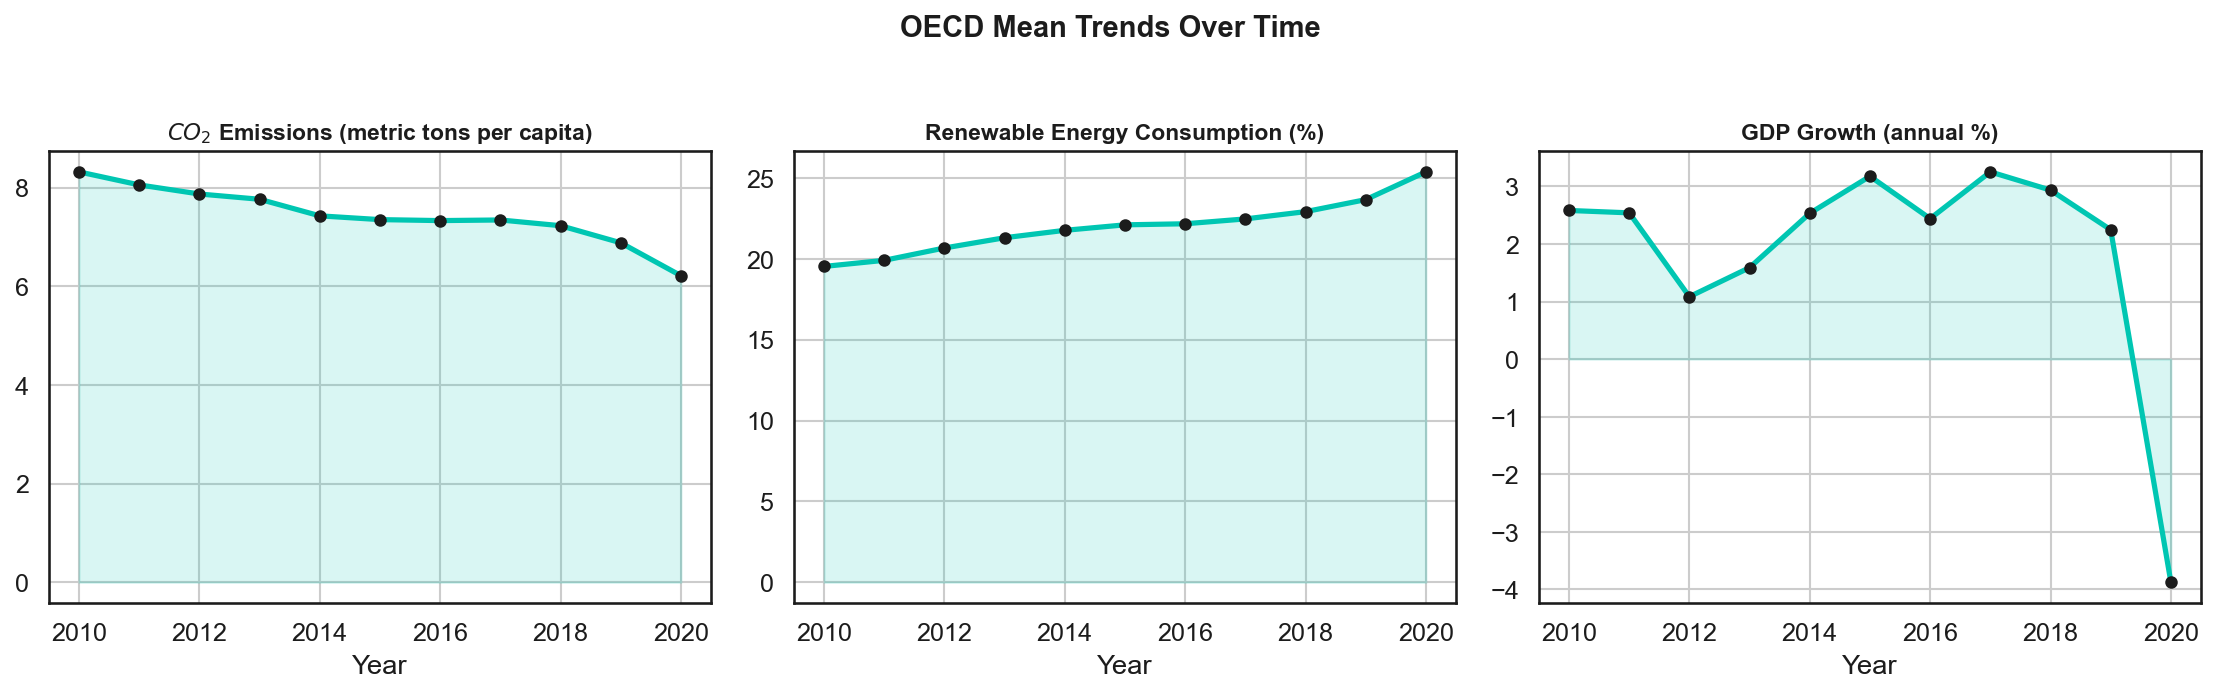
Testing whether CO₂ emissions per capita and renewable energy share predict GDP growth, across 38 OECD countries over 2010–2020, using World Bank Sovereign ESG data.
The result
R² = 0.004. The model explains essentially none of the variance in GDP growth. Three of four hypotheses fail to reject the null.
Only H₄, comparing high- and low-renewable-share groups by Welch’s t-test, reaches significance at p = 0.0460, and that is close enough to the 0.05 threshold that I would not build anything on it.
Why this is here anyway
A portfolio full of confirmed hypotheses is a portfolio that has quietly deleted its failures. This one is on the site precisely because the finding is negative.
The honest reading: at the country-year level of aggregation, with a decade of data and this set of controls, environmental performance does not predict growth. That does not mean no relationship exists. It means this design cannot see one, and the likely culprits are aggregation level and the ten-year window rather than the hypothesis itself.
What I took away
Reporting R² = 0.004 is more useful than not running the analysis. It also taught me to pre-register what I would accept as evidence before looking at the output, because the temptation to keep slicing until something crosses 0.05 was very real, and that is exactly how p-hacking happens.
How it is put together
Left to right, the path a request or a record takes through the system.
01
Source
- World Bank Sovereign ESG
- 38 OECD countries
- 2010–2020
02
Prepare
- pandas
- Country-year panel
- CO2 per capita, renewable share
03
Test
- OLS via statsmodels
- Welch's t-test on group split
- H1–H4
Four hypotheses, pre-registered.
04
Report
- R-squared 0.004
- Three of four fail to reject
- H4 at p = 0.0460
Including the null, especially.
What happens, step by step
In plain language, in the order it happens.
State what would count as evidence, first
Four hypotheses fixed before looking at any output. Deciding afterwards what counts as a finding is how p-hacking happens, and the temptation to keep slicing was very real.
Build the panel
38 OECD countries over 2010–2020 from World Bank Sovereign ESG data, at country-year granularity.
Fit the model
OLS regressing GDP growth on CO2 emissions per capita and renewable energy share.
Read the result honestly
R-squared of 0.004. The model explains essentially none of the variance. Three of four hypotheses fail to reject the null.
Refuse to over-claim the one significant result
H4: high versus low renewable share by Welch's t-test, reaches p = 0.0460. That is close enough to the threshold that I would not build anything on it, and saying so is part of the finding.
Decisions, and what they cost
Every choice worth recording has a road not taken. Both are here.
Pre-register the hypotheses
instead ofExploring and reporting what turned up
With a country-year panel and a decade of data there are enough slicing choices to manufacture significance. Fixing the tests in advance is the only thing that makes the eventual null interpretable.
Publish the null result
instead ofQuietly shelving it
Reporting R-squared = 0.004 is more useful than not running the analysis. A portfolio of only confirmed hypotheses is not evidence of good judgement, it is evidence of selective reporting.
Name the likely culprits as design, not hypothesis
instead ofConcluding no relationship exists
At country-year aggregation over ten years, this design cannot see an effect that may still exist at finer resolution or over longer horizons. The honest claim is about the instrument, not the world.
What came out of it
- R-squared of 0.004: the model explains essentially none of the variance in GDP growth.
- Three of four hypotheses fail to reject the null; H4 reaches p = 0.0460 and is not built on.
- The finding is about what this design can see: aggregation level and a ten-year window are the likely limits, not the hypothesis itself.
Still open
- Sub-national or sectoral resolution would be a genuinely different test rather than the same one repeated.
- A longer window would matter more than more countries. Eleven years is short for a growth relationship.
Built with
- Python
- statsmodels
- pandas
- OLS
- Welch's t-test