Work · Analysis · 02
Cyclistic Bike-Share: Casual to Member
5.5 million trips in BigQuery, and one finding that reframes the conversion problem.
- Type
- Analysis
- When
- Google Analytics Capstone · May 2026
- Role
- Sole analyst. Warehouse setup, SQL, segmentation, dashboard, recommendation.
- Scale
- 5.5 million trip records · past what a spreadsheet holds, which is the point
In plain language
A bike-share company wanted to know how to turn casual riders into paying members. The standard answer is to offer them a discount. Looking at 5.5 million real trips, that answer is aimed at the wrong person: casual riders are not members who have not signed up yet, they are doing something different on the bike. Members commute for twelve minutes on weekdays. Casual riders ride for nineteen minutes on Saturdays, and their weekday volume collapses by 93%. You cannot convert someone by discounting a product they were never buying.
The question
How do you convert casual riders to annual members, and is conversion even the right frame for what casual riders are doing?
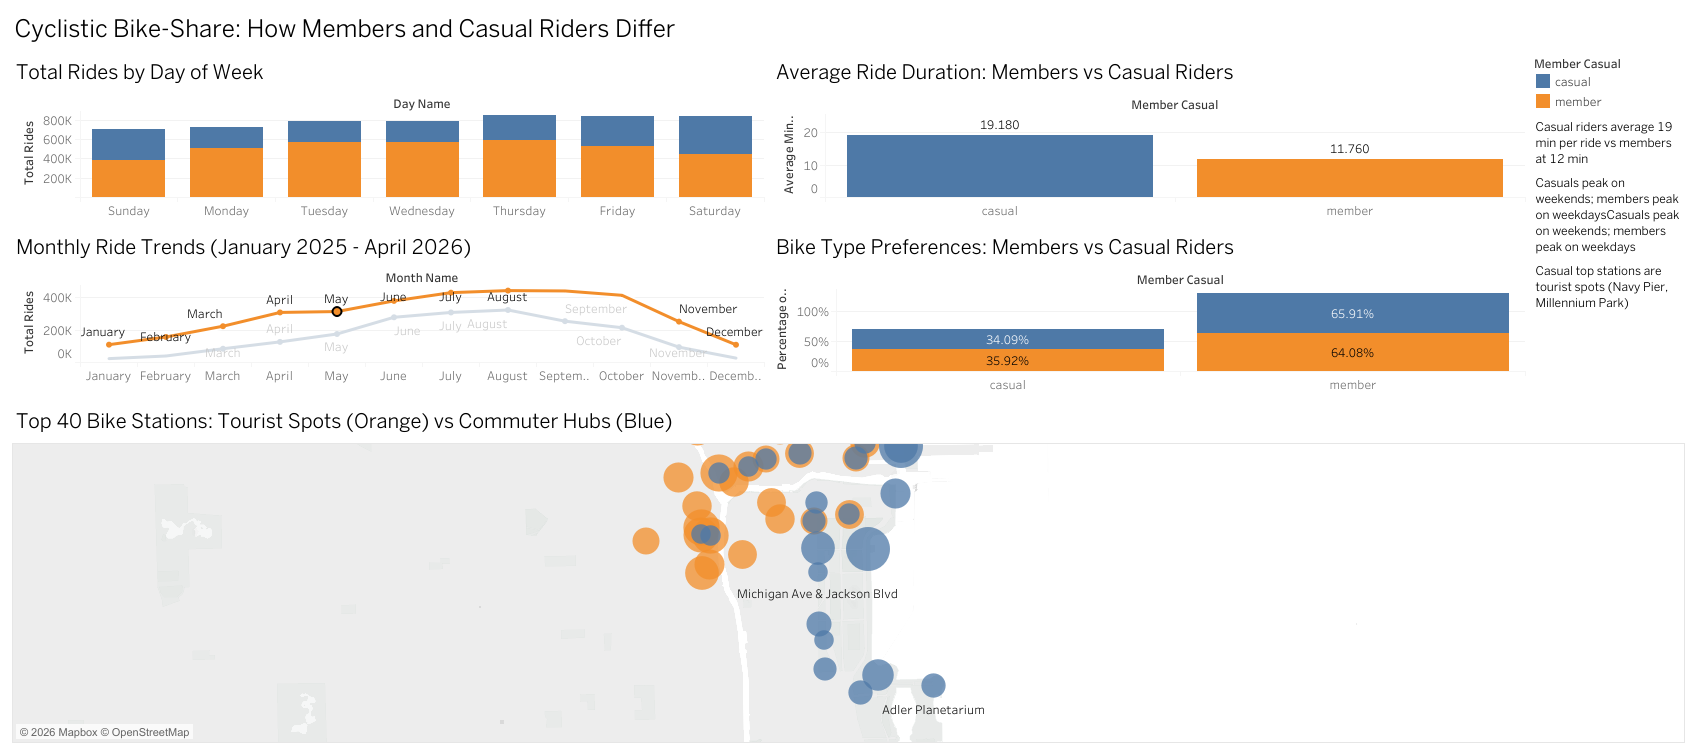
5.5 million real Divvy trip records, far past what a spreadsheet will hold, which is the point. Google Cloud Storage into BigQuery, CTEs and window functions to shape it, Tableau on the output.
The finding that matters
Casual riders are not failed members. They are a different behavioural category.
Members ride 11.8 minutes on average, on weekdays, in commute-shaped peaks. Casual riders ride 19.2 minutes, cluster on Saturdays, and their weekday volume collapses by 93%. Treating them as members-who-haven’t-signed-up-yet misreads what they are doing on the bike.
Why that changes the recommendation
The standard play is a discount on annual membership. But a discount is aimed at someone who already wants what members buy: a cheap, fast, repeated commute. Casual riders are buying a Saturday afternoon.
At a 5% conversion rate the prize is roughly 97,500 new annual members, and the way to reach it is a weekend-first product, not a cheaper version of the weekday one.
What I took away
The analysis was not hard. The framing was. I spent longer arguing myself out of the “casual = pre-member” assumption than I spent writing the SQL, and every interesting conclusion came after that.
How it is put together
Left to right, the path a request or a record takes through the system.
01
Land
- Divvy trip records
- Google Cloud Storage
Raw stays raw.
02
Warehouse
- BigQuery
- CTEs and window functions
- 5.5M rows
Aggregate where the data lives.
03
Shape
- Ride-length derivation
- Weekday and weekend segmentation
- Member vs casual splits
04
Present
- Tableau dashboard
- Conversion sizing at 5%
What happens, step by step
In plain language, in the order it happens.
Get 5.5 million trips somewhere that can hold them
Google Cloud Storage into BigQuery. Far past what a spreadsheet will hold, which is the point of the exercise rather than an inconvenience.
Shape it with SQL, not in memory
CTEs and window functions do the aggregation inside the warehouse. Pulling 5.5 million rows to a laptop to group them is the most common way this analysis gets slow.
Split the two rider types on behaviour
Ride length, day of week and time of day, compared between members and casual riders rather than assumed to differ only in payment.
Notice the shape of the difference
Members average 11.8 minutes, on weekdays, in commute peaks. Casual riders average 19.2 minutes, cluster on Saturdays, and drop 93% on weekdays. That is not one behaviour at two intensities. It is two behaviours.
Size the prize, then reframe the play
At a 5% conversion rate the prize is roughly 97,500 new annual members. The route there is a weekend-first product, not a cheaper version of the weekday one.
Decisions, and what they cost
Every choice worth recording has a road not taken. Both are here.
Aggregate in BigQuery
instead ofPulling the data into pandas
At 5.5 million rows the warehouse is where the compute belongs. Moving the rows to the analysis is the standard mistake and it converts a fast query into a slow afternoon.
Segment on behaviour
instead ofSegmenting on membership status alone
Membership is the outcome being predicted. Segmenting only by it guarantees the analysis re-describes the split it started with, which is how casual = pre-member survives contact with data.
Recommend a weekend-first product
instead ofThe standard membership discount
A discount is aimed at someone who already wants what members buy: a cheap, fast, repeated commute. Casual riders are buying a Saturday afternoon. The discount is a well-executed answer to a question nobody asked.
What came out of it
- Casual riders ride 1.63x longer than members and drop 93% on weekdays: a different behavioural category, not an unconverted one.
- Roughly 97,500 new annual members at a 5% conversion rate, which sizes the opportunity in the client's own units.
- The recommendation changed shape because the framing did, not because the SQL got better.
Still open
- No pricing elasticity data, so the weekend-product recommendation is directional rather than costed.
- One city, one operator. Whether the casual/member split generalises is untested.
Built with
- BigQuery
- SQL
- Window functions
- Tableau
- R