Work · Products · 08
Ganymede
Which delinquent borrower is worth an agent-minute, and what to say once the call starts.
- Type
- Products
- When
- 2026 · shipped
- Role
- Sole designer and developer. Data pipeline, models, allocator, coaching layer, site.
- Scale
- Two model families over a real loan-level panel · 328 measured turn gaps · 70 tests
In plain language
A collections team has more accounts in arrears than it has hours to call them. Ganymede decides which accounts are worth calling, then helps the agent through the call that follows. It ranks by the money a call is expected to recover rather than by the probability the borrower defaults. Those two orderings are not the same, and the difference is most of the value. The outcome of each call becomes the label that retrains the model that picked it.
The question
A risk score sorts borrowers by how likely they are to get worse. A collections team does not need that list. It needs the list of calls that recover the most money per agent-minute. How much does the difference between those two lists actually cost?
Rough sketch
Where things sit on the screen, and in what reading order. Drawn, not screenshotted, so it stays true when the styling moves on.
Allocator studio
Agent desk
Evidence
The wrong list
Collections software sorts by risk. It hands an agent the accounts most likely to get worse and calls that a queue. The team then works the list top down until the day runs out.
That list is wrong in a way that is easy to miss, because it is not obviously wrong. It is sorted by a real number that a real model produced. It is just sorted by the wrong number.
An agent-minute is the scarce thing. The question is not who is most likely to default. The question is where a minute recovers the most money. Two accounts make the point on their own. One carries 1,929,000 euros of exposure, an 18% chance of worsening and a 91% chance of curing itself. The other carries 1,289 euros, an 83% chance of worsening and a 33% chance of curing itself. Risk-ranking funds the small one at 5% capacity and never reaches the large one at any capacity in the sweep.
What Ganymede does
It scores two questions rather than one. Does this account worsen over the next ninety days, and does it recover without anyone calling. The second question is what turns a probability into an uplift: there is no value in calling a borrower who was going to cure on their own.
The allocator then maximises expected recovered value per agent-minute under the capacity the team actually has. “Do not contact” is a scored action with money attached, not an absence of one.
The call, and the physics of it
Once the conversation starts, the coaching layer has a hard constraint that nobody chooses. A hint has to arrive inside the pause between turns or it arrives after the moment it was for.
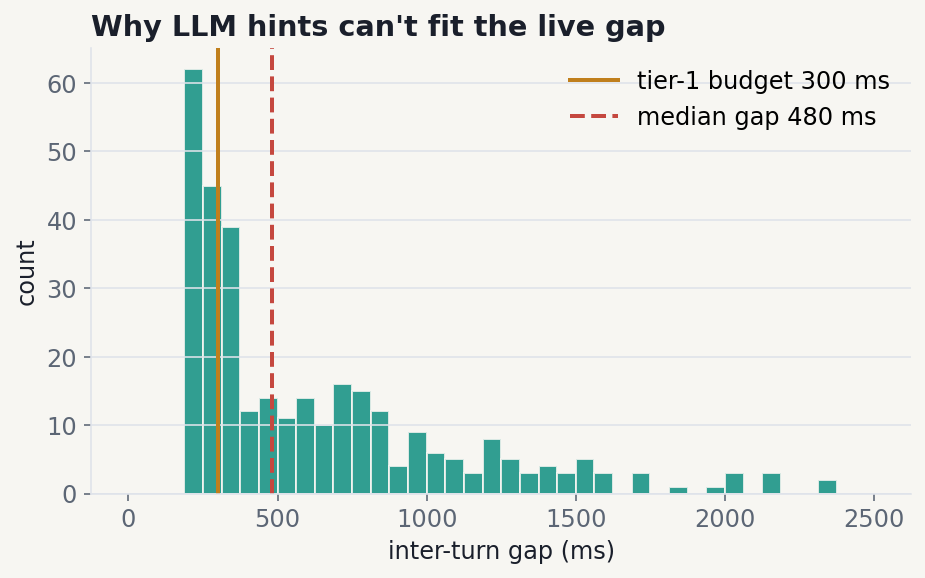
So the pause was measured rather than assumed. 328 inter-turn gaps from a ten-minute call give a median of 479 ms and a p25 of 292 ms. The budget is 300 ms, which is the p25 rounded up. At that budget 75% of real turn boundaries are wide enough. At 500 ms, which is what a model call costs, only 48% are. That single distribution forces the two-tier design: deterministic hints render in under a millisecond and land live, and model-composed strategy waits for the next pause.
What it refuses to claim
Four headline numbers are marked pending rather than estimated. Recovery lift in production, agent override rate, promise-kept lift from coaching, and whether conversation features beat tabular ones. Each needs live data or a randomised slice that is not running yet.
The last one is enforced rather than promised: the evals module refuses to compute lift on any set containing a synthetic record, because the generator’s own priors would leak into the answer and the number would look real.
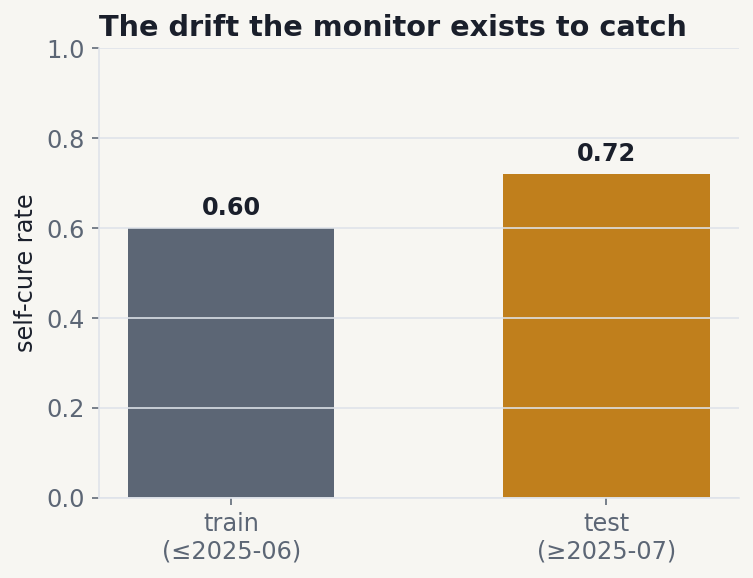
The drift monitor is treated the same way. Self-cure rate rose from 0.60 to 0.72 across the backtest window. The ranking held. Absolute calibration lagged, because no model calibrates to a regime shift it never saw. That is written down as a miss, which is what the outcome loop and the monitor exist for.
Stack
Python with Polars for the panel, LightGBM and scikit-learn for the models, and an OpenAI-compatible client for the model-composed hints. The site is static, has no framework and no build step, makes no third-party request, and reads its numbers from JSON the pipeline writes.
How it is put together
Left to right, the path a request or a record takes through the system.
01
Panel
- Loan-level servicing history
- Monthly borrower panel
- Contact events by channel
Real dates, real delinquency transitions.
02
Score
- L1 trajectory: does this worsen
- L2 self-cure: does it fix itself
- L4 promise kept
- Calibration, then reason codes
Two questions, not one.
03
Allocate
- Uplift over self-cure
- Weighted by exposure
- Under a capacity constraint
- Do not contact is a scored action
Expected value, never probability.
04
Coach
- Tier 1 renders under a millisecond
- Tier 2 waits for the next pause
- Branches on borrower state
Two tiers, set by the measured gap.
05
Learn
- Every decision logs its arm and propensity
- Promise resolved against payment
- Drift monitors on input and score
What happens, step by step
In plain language, in the order it happens.
Build the panel
Loan-level servicing history becomes a monthly borrower panel. Calendar dates are the point: a timing feature from a source without real dates is refused at the feature layer rather than caught in review.
Score two questions, not one
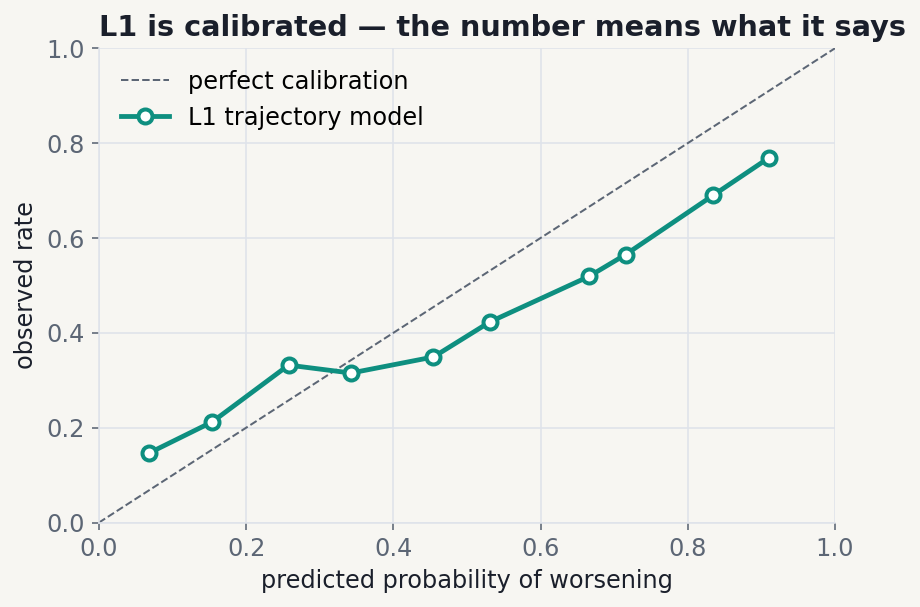
L1 asks whether the account worsens over the next ninety days. L2 asks whether it recovers without contact. An agent reads those numbers at face value, so calibration is the gate rather than AUC.
Rank by money, not by risk
The allocator maximises expected recovered value per agent-minute: uplift over self-cure, weighted by exposure, under the capacity the team actually has. Probability never sorts the queue.
Coach inside the measured gap
328 inter-turn gaps from a real call give a median of 479 ms and a p25 of 292 ms. The budget is 300 ms because that is what the distribution allows. A hint that misses the gap arrives after the moment it was for.
Log the decision, then resolve it
Every score, hint and override is written down with its experiment arm and its propensity. When the payment arrives or does not, the promise resolves and both lenses retrain on the result.
Decisions, and what they cost
Every choice worth recording has a road not taken. Both are here.
Rank by expected value
instead ofRank by probability of default
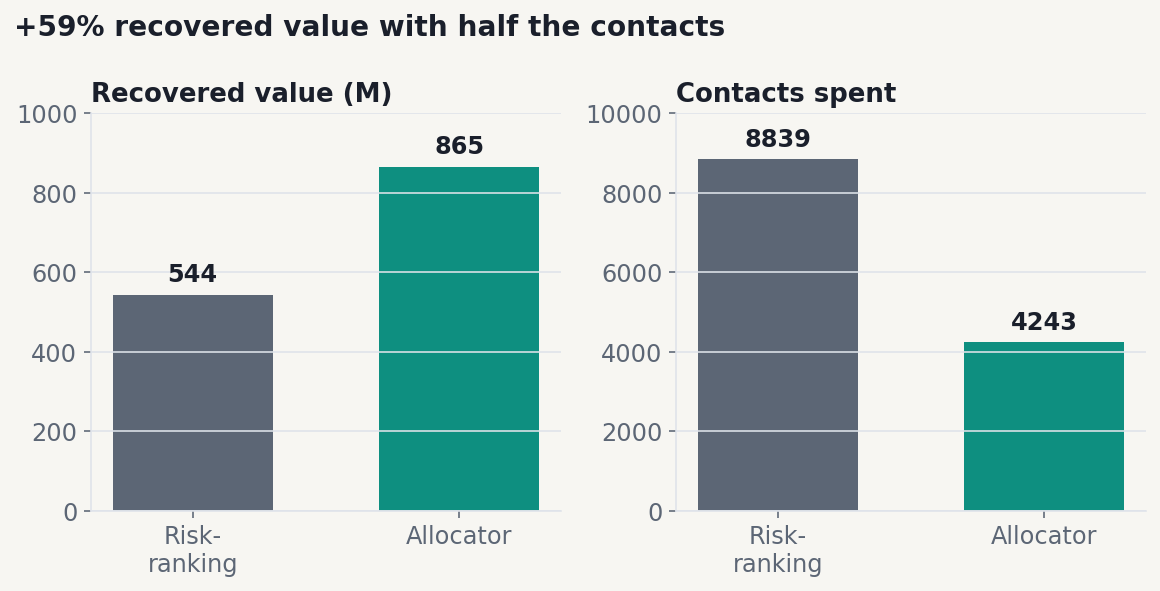
Risk-ranking calls a 1,289 euro account early and never reaches a 1.93 million euro one anywhere in the capacity sweep. Twelve agent-minutes cost more than the whole uplift on the small account is worth. At 15% capacity the value ordering recovers 59% more using roughly half the contacts. At 60% the edge falls to 2.4%, because with enough agents to call everyone the ordering stops mattering. The gain lives exactly where the constraint is real.
Calibration as the release gate
instead ofAUC as the release gate
A ranking metric says the order is right. It says nothing about whether 0.7 means seventy percent. The agent reads the number and acts on its face value, so the number has to mean what it says.
Two hint tiers split by a measured budget
instead ofOne tier, with a latency target picked in advance
75% of real turn boundaries are wide enough for a hint at 300 ms. Only 48% are wide enough for a 500 ms model call. Deterministic hints therefore land live, and model-composed strategy waits for the next pause instead of racing a budget it loses.
Refuse four headline numbers
instead ofEstimate them from simulation
Recovery lift, override rate, promise-kept lift from coaching, and conversation features beating tabular features all need live data or a randomised slice. Each could have been estimated into something impressive. Each carries a pending badge instead. The evals module refuses to compute lift on synthetic records at all, because the generator's own priors would leak into the answer.
Generate every figure on the site from the pipeline
instead ofWrite the numbers into the page
A build script regenerates the site data by calling the pipeline, and every value ships with the evidence behind it: measured, backtested, simulated, seeded or pending. A figure with no provenance cannot render. CI fails if the committed data drifts from what the code now produces.
Fourteen review findings as runnable invariants
instead ofA postmortem list
A defect is closed when something automated fails if it comes back, never before. The queue producer is the only path to a queue. The experiment arm is non-nullable. The retrain aborts on a row with no propensity. A list in a document cannot do any of that.
What came out of it
- Live. The capacity slider runs real allocator output at every position rather than interpolating between two.
- Value-ranking recovers 59% more than risk-ranking at 15% capacity, and 193% more at 2%.
- The risk model is calibrated against a held-out time split, so the score reads as a probability.
- The drift monitor caught a regime shift: self-cure rose from 0.60 to 0.72 across the window. Ranking held, absolute calibration lagged, and the miss is reported rather than smoothed.
- Fourteen invariants, seventy tests and five build gates all run before anything ships.
Still open
- Recovery lift in production cannot be estimated from simulation. The control arm measures it or nobody does.
- Override rate and promise-kept lift from coaching both need agents using the system.
- Whether conversation features beat tabular features is blocked by design. The metrics module will not compute that number on synthetic records.
Built with
- Python
- Polars
- LightGBM
- scikit-learn
- Calibration
- Uplift modelling
- LLM orchestration
- Vercel